


Site Debugging in NetBeans
The "conventional" debugging technique in PHP is putting the var_dump() function
in the code block that you want to examine:
var_dump($var);

exit;
The lines above would print the value of the $var variable to the browser's output
and then stop program execution. While this can be used for debugging even a complex
site, it makes the debugging a pain, because you have to type variable dump commands in your PHP source file,
then refresh your web page in the browser to see the output, then edit the source file again, until you
determine the reason of the problem.
In contrast, when you debug your website in NetBeans IDE, the PHP interpreter pauses program execution flow at every line where you set a breakpoint. This makes it possible to conveniently retrieve information about the current state of the program, like the values of the local variables and the call stack. You see the debugging information in NetBeans window in graphical form.
To be able to debug the site, you need to have the XDebug extension installed. If you haven't installed it yet, please refer to Appendix A. Configuring Web Development Environment for additional information on how to install it.
To start the debugging session, in NetBeans window, click the Debug button on the Run Toolbar (figure B.4). Alternatively, you can press the CTRL+F5 key combination on your keyboard.
If everything is OK, you should be able to see the current program counter on the first code line of the index.php file (shown in figure B.5):
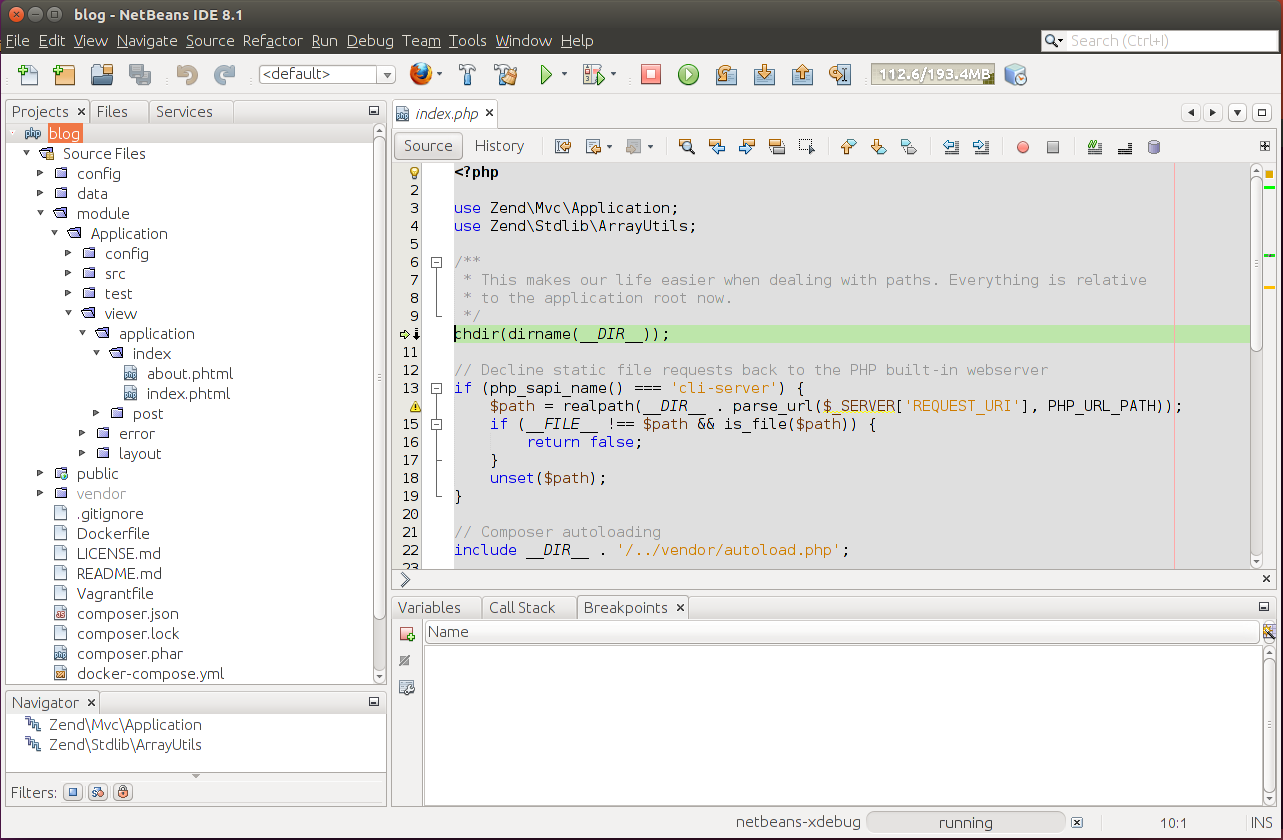 Figure B.5. Debugging Session
While the program is in paused state, your web browser's window is frozen, because the browser is waiting for data from the web server. Once you continue program execution, the browser receives the data, and displays the web page.