


Profiling
When your site is ready and working, you are typically interested in making it as fast and performing as possible. XDebug provides you with an ability to profile your website. Profiling means determining which class methods (or functions) spend what time to execute. This allows you to determine the "bottle neck" places in your code and address the performance issues.
For each HTTP request, the XDebug extension measures the amount of time a function executes,
and writes the profiling information to a file. Typically, the profiling info files are placed
into the system temporary directory (in Linux, to /tmp directory) and have names like
xdebug.out.<timestamp>, where the <timestamp> placeholder is the timestamp of the HTTP request.
All you have to do is to open a profiling file and analyze it.
To enable XDebug profiler, you should set the following XDebug configuration parameter in your xdebug.ini file:
xdebug.profiler_enable = 1
Unfortunately, NetBeans for PHP does not have an embedded tool for visualizing the profiling results. That's why you need to install a third-party visualizer tool. Below, we will provide instructions on how to install a simple web-based tool named Webgrind. Webgrind can work on any platform, because this tool itself is written in PHP.
Webgrind's installation is very straightforward.
First, you need to download webgrind from its project page and unpack it to some folder. In Linux, you can do this with the following commands:
$ cd ~

$ wget https://github.com/jokkedk/webgrind/archive/master.zip

$ unzip master.zip
The commands above will change your working directory to your home directory, then will download the Webgrind archive from the Internet, and then unpack the archive.
Next, you need to tell the Apache web server where to find Webgrind files. This means you need to configure a separate virtual host. We have already learned about virtual hosts in Appendix A. Configuring Web Development Environment. Do not forget to restart Apache web server after you have configured the virtual host.
Finally, open Webgrind in your browser by navigating to the URL of your Webgrind install. For example, if you configured the virtual host to listen on port 8080, enter "http://localhost:8080" in your browser's navigation bar and press Enter. The Webgrind web page should appear (see figure B.13):
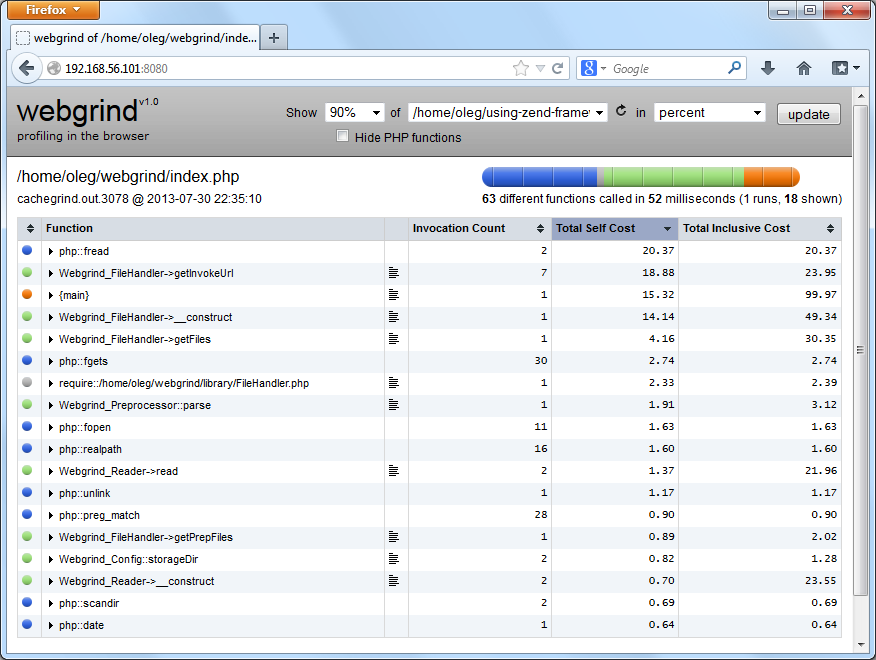 Figure B.13. Webgrind Output Page
At the top of the Webgrind page, you can select the percentage of the "heaviest" function calls to show (figure B.14). By default, it is set to 90%. Setting this to a lower percentage will hide the functions called less often.
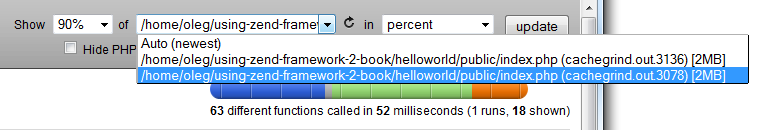 Figure B.14. Webgrind Select
The drop-down list to the right of percent field allows to select the profiling data file to analyze. By default, it is set to "Auto (newest)", which forces Webgrind to use the file with the most recent timestamp. You may need to select another file, for example, if your web pages use asynchronous AJAX requests.
The right-most drop-down list allows to set the units which should be used for measuring the data. Possible options are: percent (default), milliseconds and microseconds.
When you have selected the percentage, file name and units, click the Update button to let Webgrind to visualize the data for you (the calculation may take a few seconds). As the calculation finishes, you should be able to see the table of function calls, sorted in descending order by function "weight". The heaviest functions will be displayed at the top.
The table has the following columns:
The first column (Function), displays the class name followed by method name (in case of a method call) or function name (in case of a regular function).
The second column contains the "paragraph" icons, which can be clicked to open the corresponding PHP source file that function is defined in the web browser.
Invocation Count column displays the number of times the function was called.
Total Self Cost column shows the total time it took to execute the built-in PHP code in the function (excluding the time spent on executing other non-standard functions).
Total Inclusive Cost column contains the total execution time for the function, including built-in PHP code and any other user functions called.
Clicking a column header allows to sort data in ascending or descending order.
You can click the triangle icon next to a function name to expand a list of function invocations. This list allows you to see who called this function and what the amount of time spent is, and contains the following columns:
- Calls is the "parent" functions or class methods invoking this (child) function;
- Total Call Cost is the total time executing this function, when called from the parent function;
- Count - number of times the parent calls the child function.
The coloured bar at the top of the page displays the contribution of different function types:
- Blue denotes PHP internal (built-in) functions;
- Lavender is time taken to include (or require) PHP files;
- Green shows the contribution of your own class methods;
- Orange denotes time taken on traditional "procedural" functions (functions that are not part of a PHP classes).
Please note that the profiler creates a new data file in your /tmp directory for each HTTP request to your website. This may cause disk space exhaustion, which can be fixed only by rebooting your system. So, when you've finished profiling your application, it is recommended to disable the profiling by editing the php.ini file, commenting the
xdebug.profiler_enableparameter as follows, and then restarting the Apache web server.
;xdebug.profiler_enable = 0